> For the complete documentation index, see [llms.txt](https://eaclouddoc.eauditor.eu/llms.txt). Markdown versions of documentation pages are available by appending `.md` to page URLs; this page is available as [Markdown](https://eaclouddoc.eauditor.eu/eacloud-docs-en/features/tools/reports.md).
# Reports
## **Reports**
The Reports module enables viewing, generating, and managing reports within the eAuditor system. It facilitates configuration of report schedules and allows automatic delivery to designated e-mail addresses or saving to a chosen location. The primary focus is on quick access to reports, managing favorite reports, and the history of generated reports.
### **Key features**
#### **Reports overview**
* **Displaying report categories** – The system allows previewing available reports grouped by category.
* **Filtering** – Ability to sort reports by category and date of last generation.
#### **Generating reports**
* **Report selection** – A list of available reports presented as tiles.
* **Report configuration** – The form allows setting report parameters such as date range and e-mail addresses to which the report should be sent.
* **Saving and delivery** – Option to save the report locally or send it by e-mail.
#### **Schedule management**
* **Generation frequency** – Ability to configure reports to be generated daily, weekly, monthly, or yearly.
* **Automatic delivery** – Reports can be sent by e-mail or automatically saved to a selected location.
### **View structure**
The reports view is divided into three sections:
1. **Reports center** – Preview of available reports, divided into:
1. **System templates** – Reports predefined by the vendor.
2. **Private templates** – Reports created by the user, visible only to them.
2. **Report schedules** – Configuration of periodic report generation.
3. **Reports history** – A list of recently generated reports, with the option to download them again.
### **Elements of the reports view**
#### **Presentation of report templates**
Each report in the reports view is presented as a tile that contains:
* **Report icon** – Visual identification of the report.
* **Report name** – Highlighted next to the icon.
* **Category** – Information about which category the report is assigned to.
* **Description** – A short description of the report contents.
* **Information about the last generation** – Date, time, and the user who last generated the report.
* **"Generate now" button** – Clicking opens the report configuration menu.
#### **Filters and search**
* **Text filter** – Allows searching reports by name.
* **Dropdown filter** – Enables filtering reports by category.
## **Report generation process**
1. **Report selection** – Click “Generate now” on the tile of the selected report template.
2. **Report configuration**:
1. Indicate the devices and users to which the report template applies (it may have these values preassigned)
2. Optionally configure additional options (e.g., advanced filtering or column selection).
3. Specify the e-mail addresses to which the report should be sent.
3. **Report generation** – Click “Generate report” to start the process.
## **Adding and editing report templates**
### **Creating a new report template**
{% stepper %}
{% step %}
### + New report template
{% endstep %}
{% step %}
### Selecting the data source
The user indicates the data that will form the basis of the report (e.g., computers, users).
{% endstep %}
{% step %}
### Report configuration
Enter the report name, select category, format, and tags. Then assign the users and computers the report should target (by default all users and all computers are selected).
Optionally you can specify e-mail addresses to which the report should be sent. These addresses can also be added or edited later.
Advanced settings allow defining report columns and filters — this directly affects its content and appearance. More on this topic is provided later in this entry.
Optionally you can also configure the report generation schedule. This can be done both during report creation and later.
{% endstep %}
{% step %}
### Conclusion
Click “Create template” to save the configuration.
{% endstep %}
{% endstepper %}
### **Advanced report filtering process**
The Reports module offers a wide range of advanced data filtering options that can be included in the report.
#### **Adding filters**
{% stepper %}
{% step %}
### Advanced settings
Allows configuration of filters for the report.
{% endstep %}
{% step %}
### Column selection
The user selects the column to which the filter should apply (e.g., "Computer Name", "BitLocker Status").
{% endstep %}
{% step %}
### **Filters - Logical operator**
Ability to choose one of the available operators:
* **Equal** – The column value must be identical to the specified value.
* **Not equal** – The column value must differ from the specified value.
* **Greater than or equal** – The value must be greater than or equal to the specified value.
* **Less than or equal** – The value must be less than or equal to the specified value.
* **Contains** – The column value must contain the specified text.
* **Does not contain** – The column value must not contain the specified text.
**Providing the filter value** – Enter text, a number, or select a value from a dropdown list, according to the data type in the column.
{% endstep %}
{% step %}
### Managing filters
* **Adding additional filters** – You can add multiple filters that will be linked by logical operators:
* **AND** (and) – All conditions must be met.
* **OR** (or) – It is sufficient that one of the conditions is met.
* **NOT** (not) – Data must meet the negative criterion.
* **Editing filters** – Each filter can be modified by changing the column, operator, or value.
* **Deleting filters** – The trash icon next to each filter allows its removal.
{% endstep %}
{% step %}
### Testing filters
Button **Test filters** – Allows the user to verify whether the configured filters operate as expected. Testing enables previewing the data that meet the established criteria before generating the report.
{% endstep %}
{% step %}
### Sorting
Select a column and set ascending or descending sorting.
{% endstep %}
{% endstepper %}
#### **Example filter configuration**
1. Column selection: "Operating System".
2. Operator: "Contains".
3. Value: "Server".
The added filter will include only data for computers whose operating system name contains the word "Server".
## **Editing and duplicating**
* **Edit** – Ability to modify an existing report, available under the “pencil” icon.
* **Duplicate** – Creating a new report based on an existing template, available under the duplication icon.
* **Deletion** - deleting a private report template.
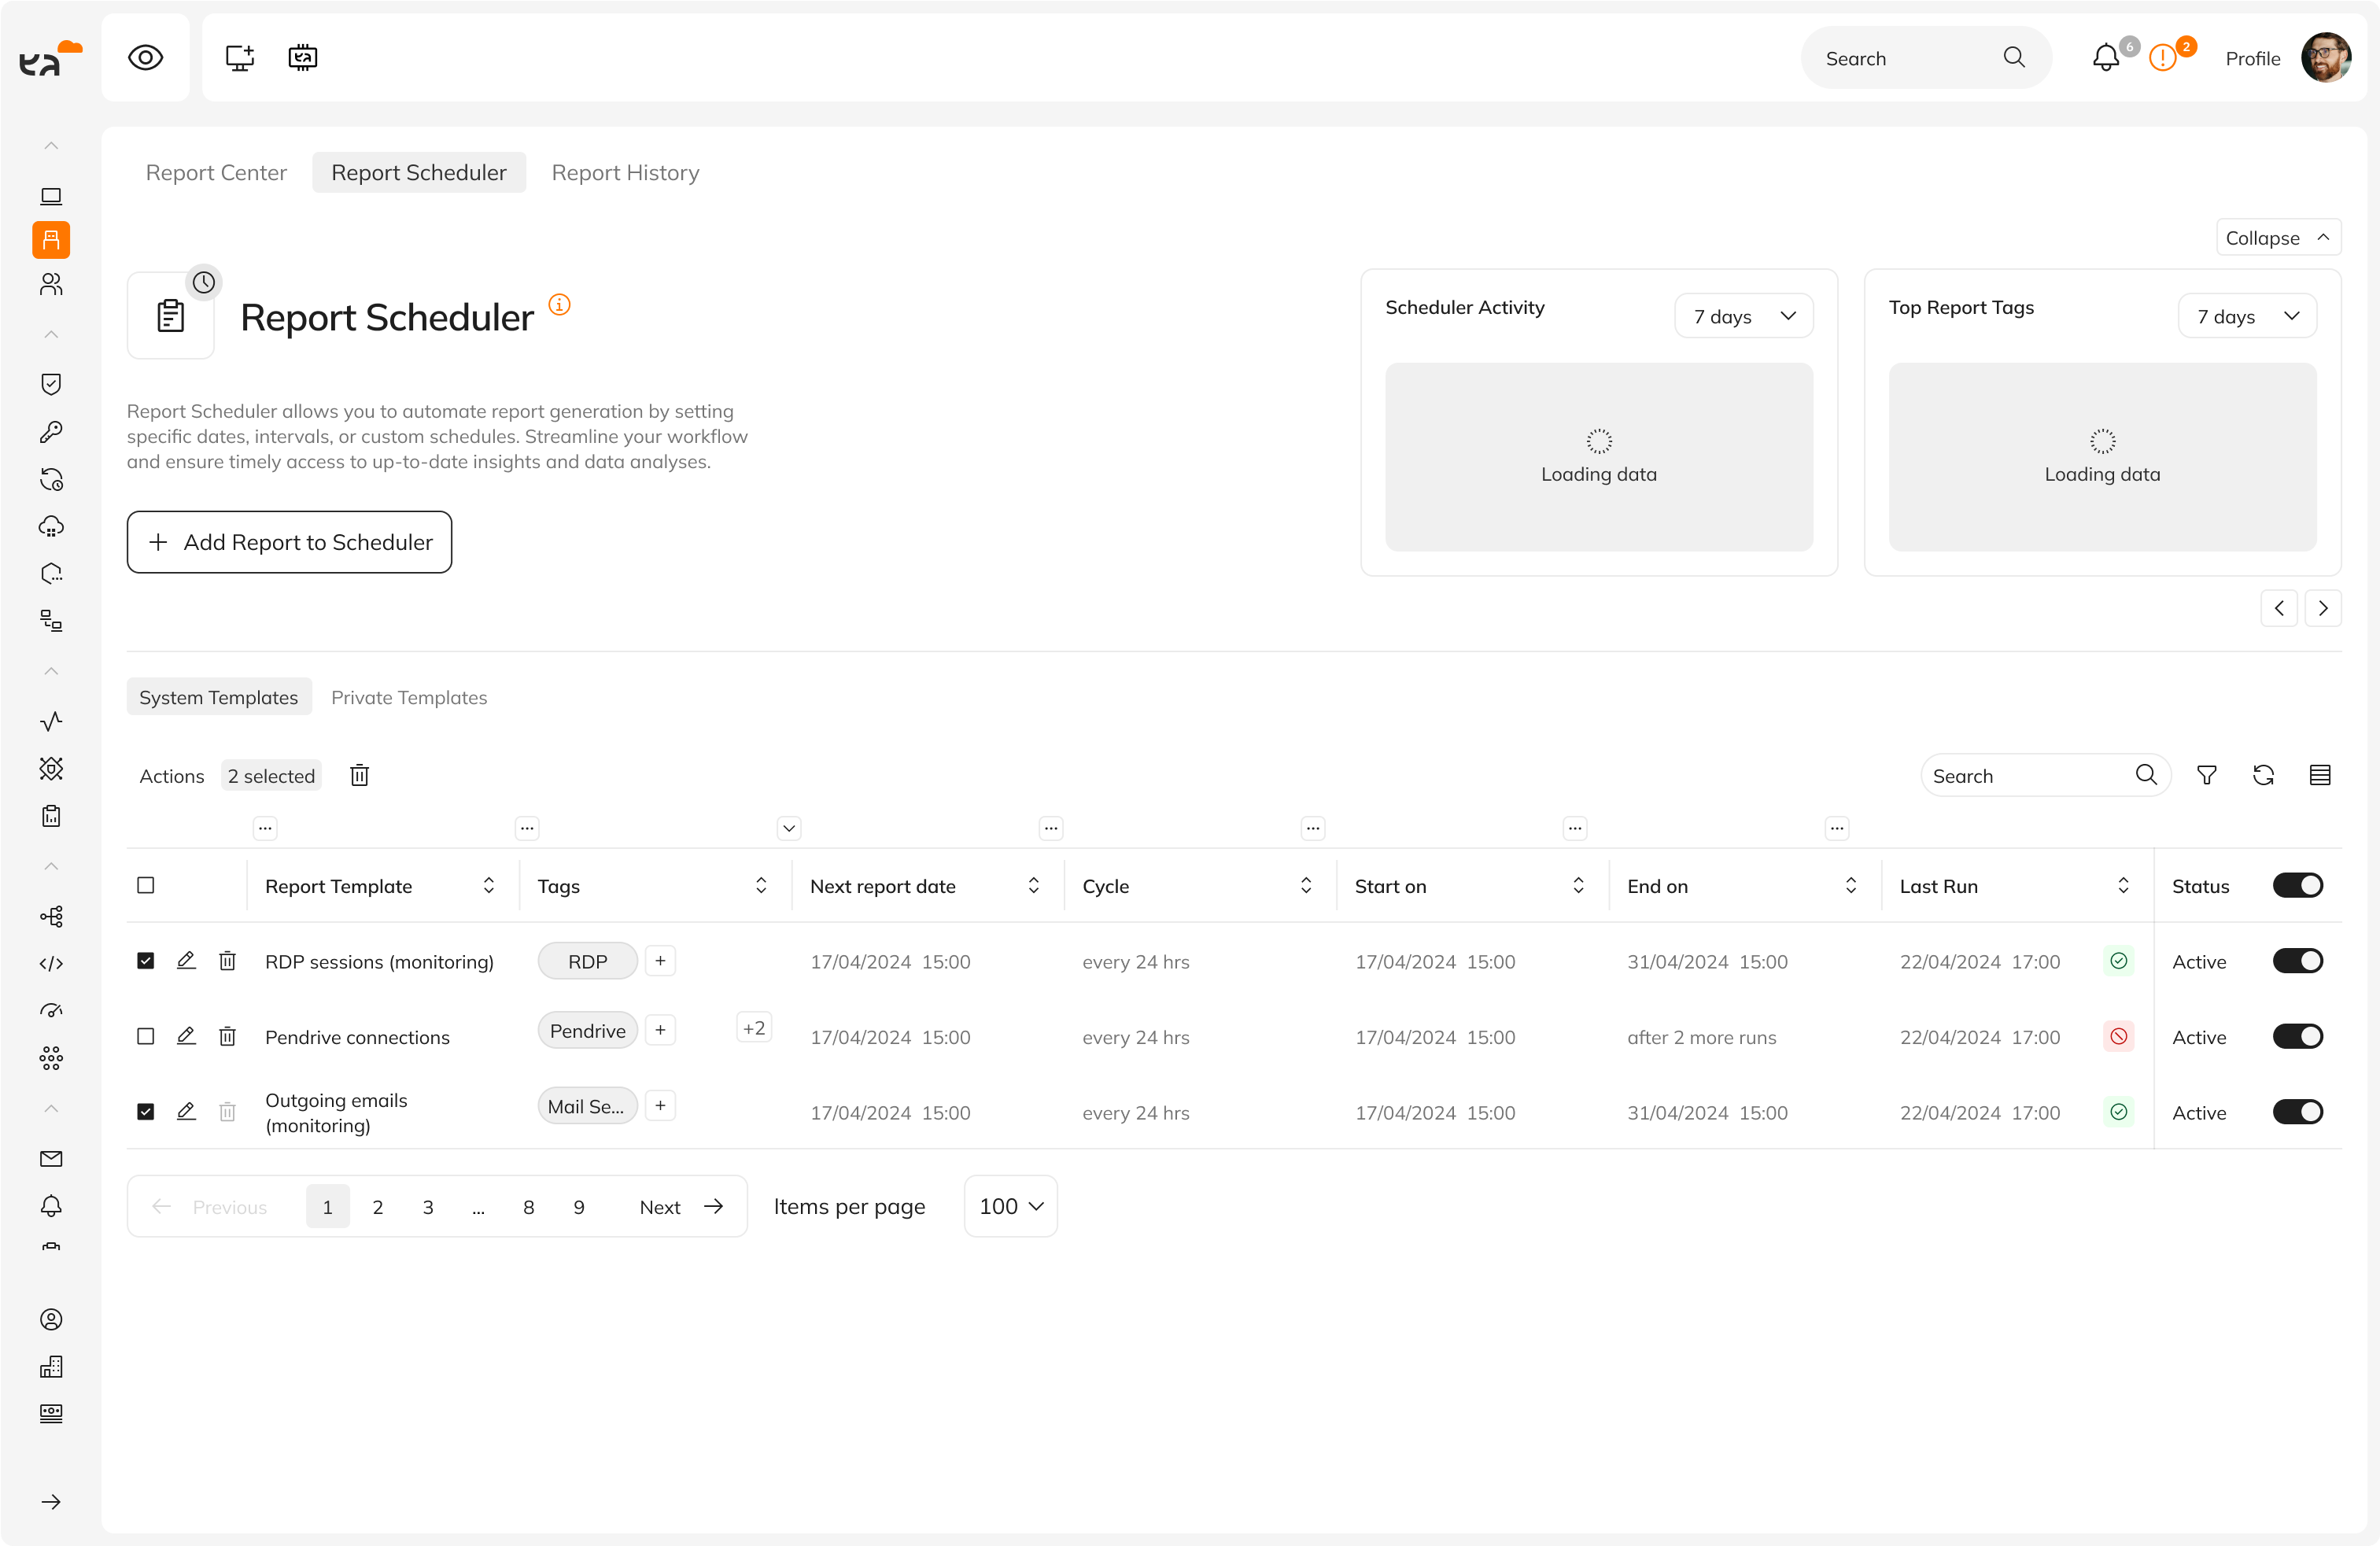
## **Managing report schedules**
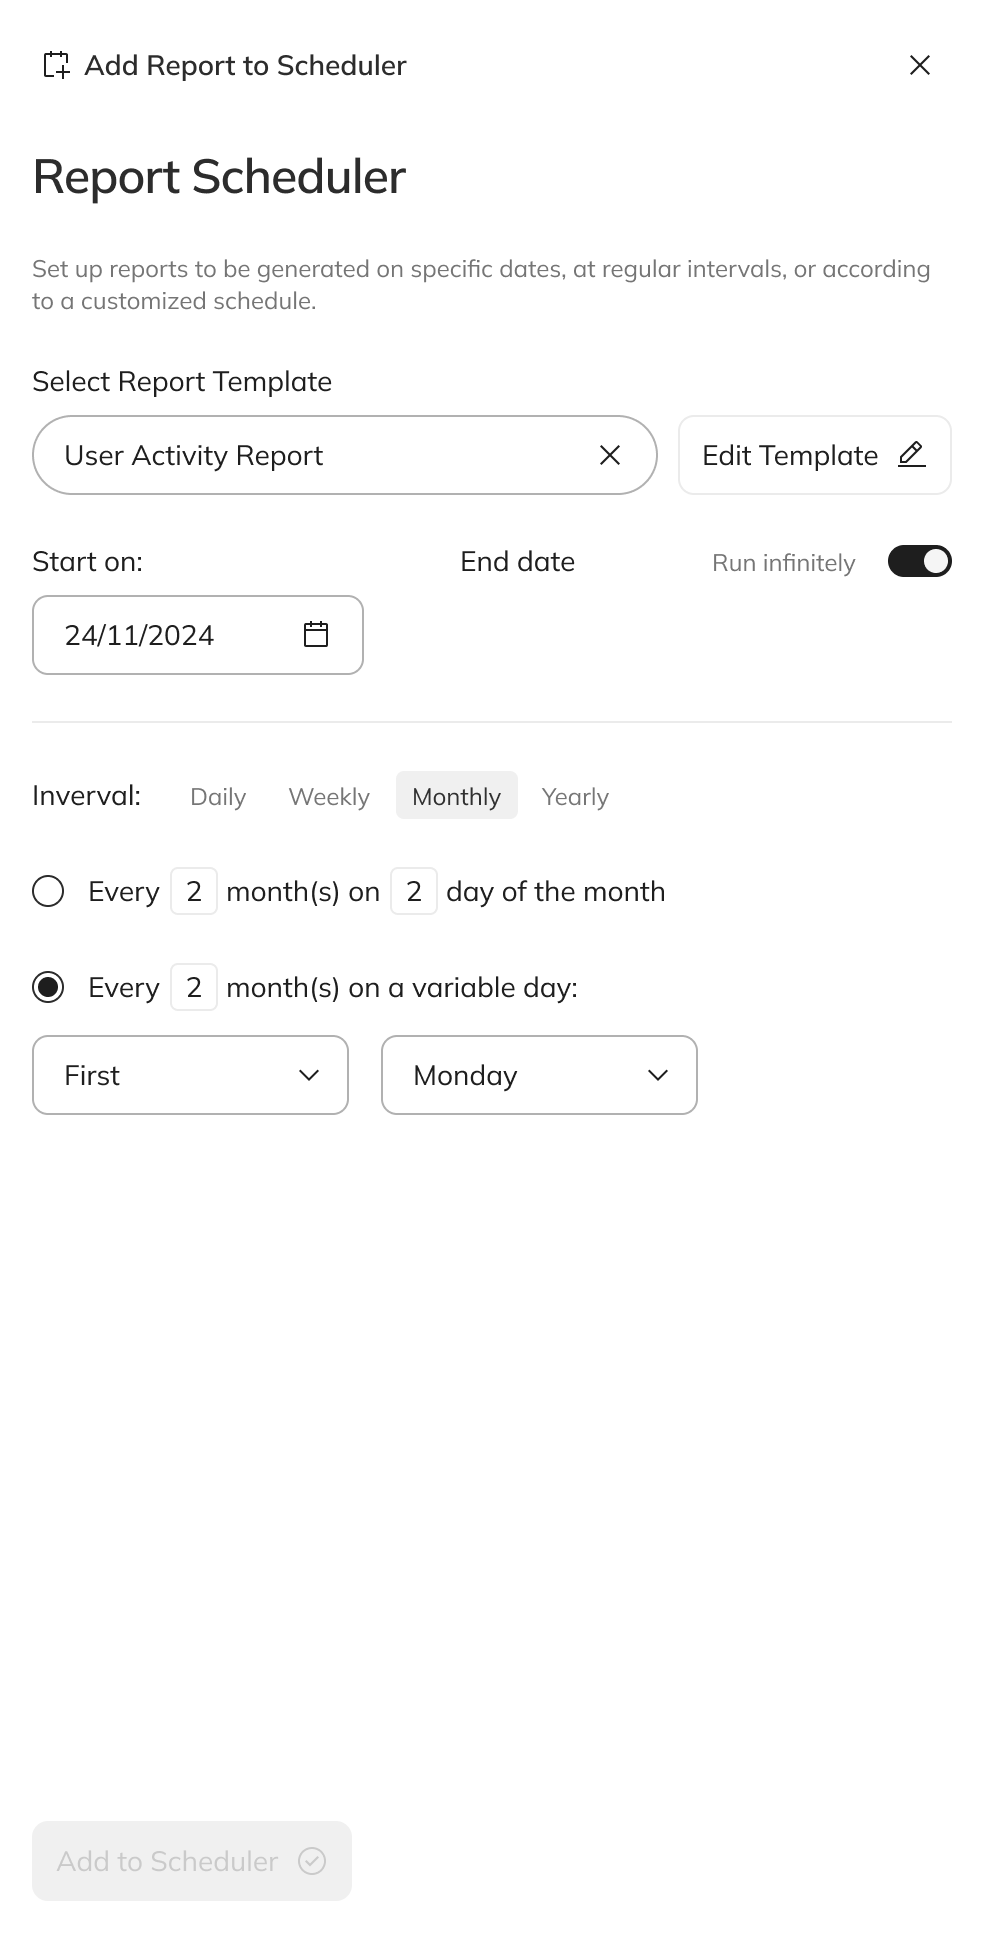
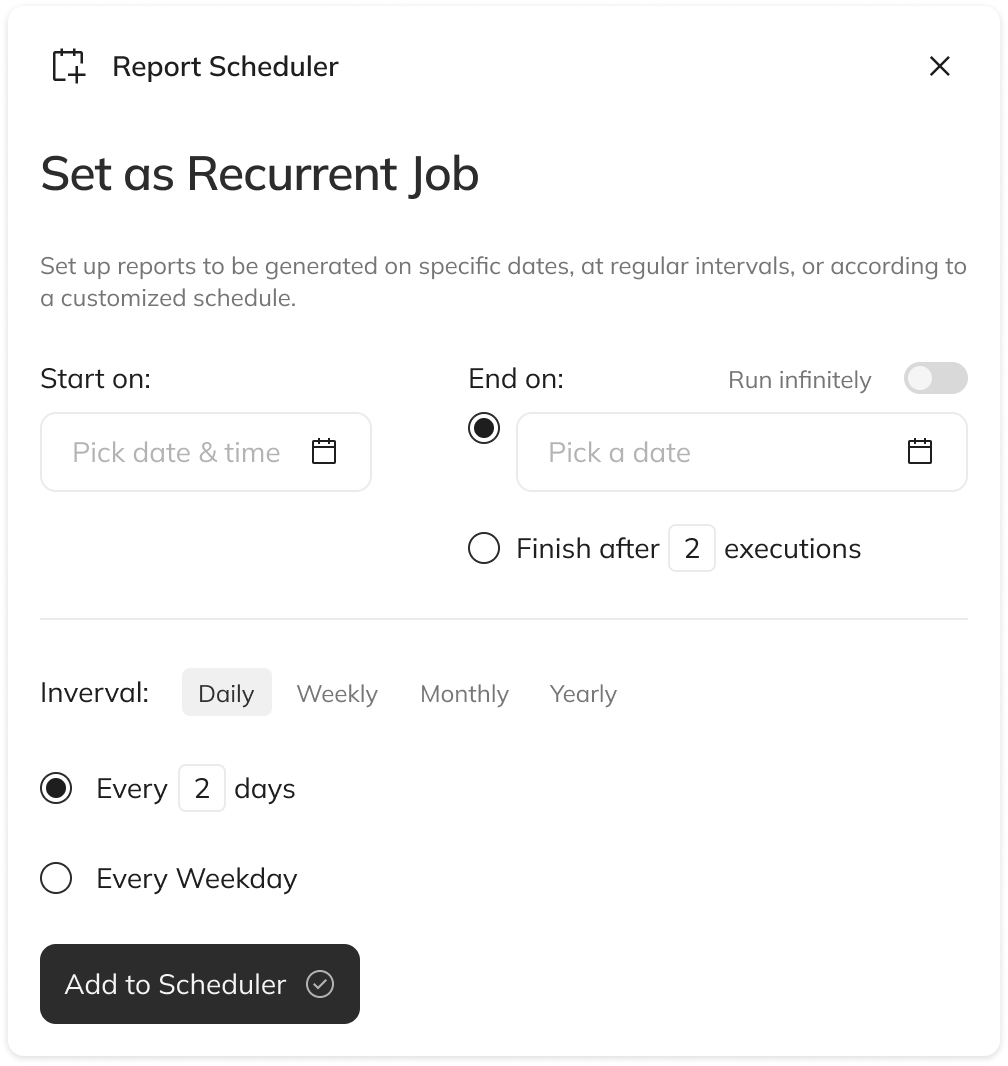
1. **Creating a schedule**:
1. Click **+ Add report to Schedule**.
2. Select a report template from the list of available templates.
3. Set the schedule start and end dates (or select “no end”).
4. Select the generation frequency (daily, weekly, monthly, yearly).
**Editing a schedule** – Ability to modify existing schedules.
**Deleting a schedule** - deleting an existing schedule.
**Deactivating a schedule** - disables the report schedule regardless of its configuration.
## **Reports history**
The reports history section allows:
* Preview of all previously generated reports.
* Downloading reports locally or resending them by e-mail.
## **Summary**
The Reports module in the eAuditor system provides comprehensive capabilities for viewing, creating, and managing reports. An intuitive interface, advanced configuration options, and automation of reporting processes facilitate the work of administrators and system users.
---
# Agent Instructions
This documentation is published with GitBook. GitBook is the documentation platform designed so that both humans and AI agents can read, navigate, and reason over technical content effectively. Learn more at gitbook.com.
## Querying This Documentation
If you need additional information that is not directly available in this page, you can query the documentation dynamically by asking a question.
Perform an HTTP GET request on the current page URL with the `ask` query parameter, and the optional `goal` query parameter:
```
GET https://eaclouddoc.eauditor.eu/eacloud-docs-en/features/tools/reports.md?ask=&goal=
```
`ask` is the immediate question: it should be specific, self-contained, and written in natural language.
`goal` is optional and describes the broader end goal you are ultimately trying to accomplish on behalf of the user. GitBook uses it to tailor the answer towards what is most useful for that goal.
The response will contain a direct answer to the question and relevant excerpts and sources from the documentation.
Use this mechanism when the answer is not explicitly present in the current page, you need clarification or additional context, or you want to retrieve related documentation sections.



 **Editing a schedule** – Ability to modify existing schedules.
**Deleting a schedule** - deleting an existing schedule.
**Deactivating a schedule** - disables the report schedule regardless of its configuration.
**Editing a schedule** – Ability to modify existing schedules.
**Deleting a schedule** - deleting an existing schedule.
**Deactivating a schedule** - disables the report schedule regardless of its configuration.

